Event Explorer. Search, Filter, and Understand Your Event Data
Your events tell a story. Who signed up, what they clicked, which pages they visited, when they dropped off. But a raw event log is just noise until you can slice through it.
Event Explorer is a new section in your dashboard that lets you search, filter, and visualise your event stream. It's designed to answer questions fast: "What did this user do?" or "How many page views came from this IP range?" or "Show me everything except my own test events."
Token-based search
The search bar works like a query builder. Type @ to pick a filter type — event name, user, session ID, IP address, or property — then enter a value. Each filter becomes a coloured chip in the bar. Stack as many as you need.
Filters combine with AND logic. So @event:page_view plus @user:[email protected] shows only Jane's page views. You can also type plain text to do a fuzzy search across event names and user identifiers.
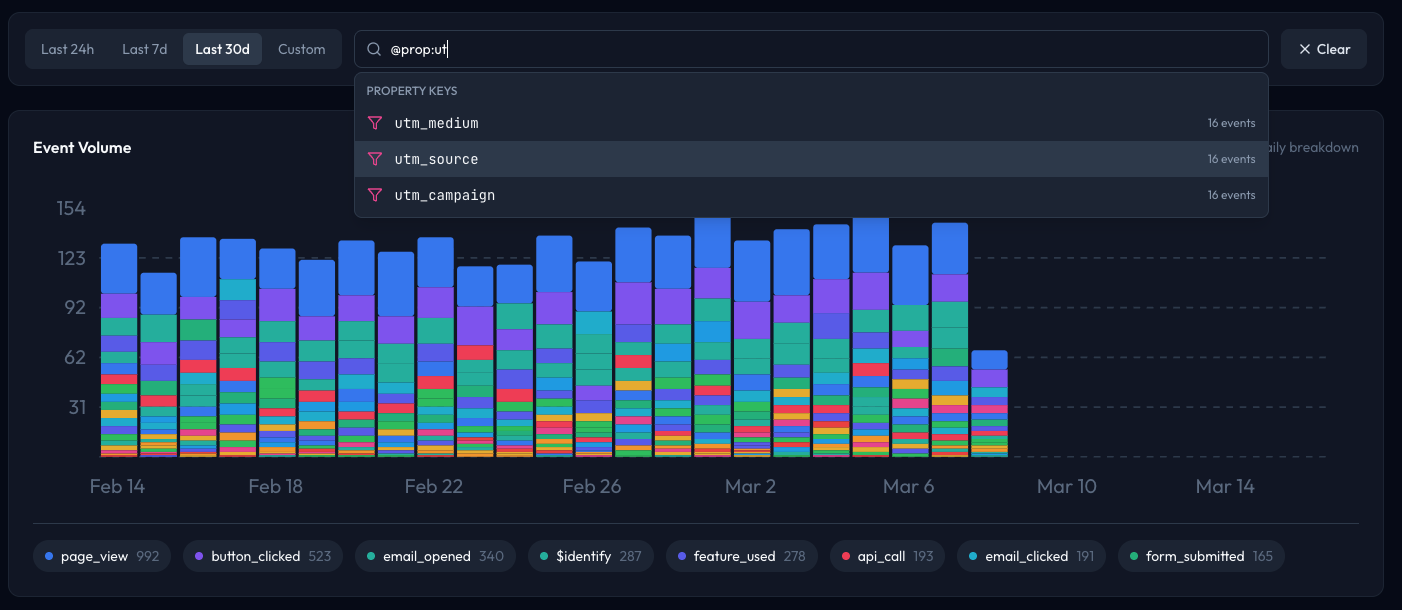
Property autocomplete
When you type @prop:, Explorer pulls the property keys from your recent events and suggests them in a dropdown. Pick a key (like utm_source or plan) and it then shows you the actual values that exist for that key. No guessing, no docs lookup. Your data tells you what's filterable.
Negation filters
Sometimes you want to see everything except certain events. Prefix any filter with ! to exclude it. Type !@user:[email protected] to filter yourself out of the results, or !@event:heartbeat to hide noisy system events.
Negated tokens show up in red with a strikethrough, so it's obvious what's being excluded. The volume chart and summary stats update accordingly.
Saved views
Found a filter combination you keep coming back to? Save it as a named view. Views appear as pills above the search bar. Click one to restore its filters instantly. You can rename them, update them with your current filters, or delete them when they're no longer useful.

Views are shared across your team, so everyone sees the same set of bookmarks.
Live volume chart
The top of the page shows an event volume chart broken down by event type. It updates as you apply filters, so you can visually confirm that your query matches what you expect. The chart auto-selects hourly or daily buckets depending on your date range.
Date presets
Quick-select buttons let you jump to the last 24 hours, 7 days, 30 days, or 90 days. Or set a custom date range. The chart, event list, and summary stats all respond to the selected range.
Available now
Event Explorer is live in your dashboard today. No setup required — if you're sending events through the MailJunky SDK or API, your data is already there waiting.
Open Event Explorer and start digging into your data.